STS News, Spring 2021 — As part of the Society’s ongoing initiatives to facilitate quality measurement, STS has launched a powerful, first-of-its-kind tool for Adult Cardiac Surgery Database (ACSD) participants—the Longitudinal Outcomes Dashboard.
With the dashboard, “surgeons and data managers will be able to track important outcome trends over select timeframes for patient subcohorts in their program in a way never before realized,” said Vinay Badhwar, MD, Chair of the STS Council on Quality, Research, and Patient Safety.
The Longitudinal Dashboard allows data managers and surgeons to explore their observed, expected, and risk-adjusted rates for major morbidity and mortality outcomes. They can select the specific type of cardiac procedure, define the data aggregation timeframe—calendar year, quarter, or month—and fine-tune the data to specific demographic subcohorts and certain surgical parameters.
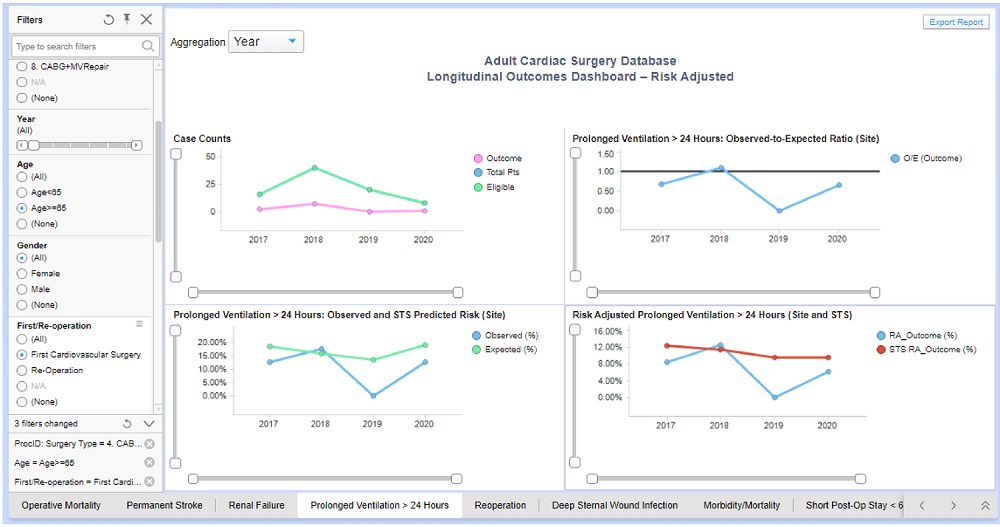
ACSD participants also can use the dashboard to display their site’s performance longitudinally over time—back to 2017 and up to the most current analyzed data harvest—and benchmark against their own outcomes, risk adjust based on STS risk models, and contrast with corresponding national averages. Participants can select 3-year periods corresponding to a specific data harvest or use the cumulative longitudinal dataset that is updated quarterly after each data harvest.
These results are available for nine major outcome measures. “This is a transformative way to bring years of data to your fingertips,” said Dr. Badhwar.
Participants can see, for example, how many patients experienced stroke or renal failure associated with an operation, how many patients required prolonged ventilation, and how many patients stayed in the hospital for more than 14 days for one procedure.
Importantly, using the same time parameters and risk models, data managers and surgeons can compare outcomes or their procedure-specific performance to those in the national data, and they can see where they fall on observed versus expected rates for each outcome and overall procedure grouping as well as for specific patient subgroups.
The Longitudinal Dashboard also allows insights into fluctuations in patient volume, enabling a focused perspective on factors—such as the effect of competing treatment options or decreasing numbers of cardiothoracic surgeries as the COVID-19 pandemic peaked—that affect procedures or site operations.
Another noteworthy feature is the flexibility of the display, such as making graphs larger or smaller and displaying numerical values. Using these comprehensive, risk-adjusted data views, participants can pinpoint areas where certain patient or procedure factors may play a role in surgical outcomes and quality measures at their program.
"Tools like this punctuate how STS is advancing quality through innovation that leverages the rich data in the STS National Database."
For example, a user might see better outcomes in older versus younger patients for a set time period and can then further drill down by sex to see outcomes in older male versus older female patients. In this way, said Dr. Badhwar, data managers can identify trends, as well as areas needing improvement that could become a quality enhancement initiative. “Tools like this punctuate how STS is advancing quality through innovation that leverages the rich data in the STS National Database,” he said.
Participants also can export illustrative charts and customized reports that can be used in quality improvement presentations to help explain performance to stakeholders and demonstrate where improvements have taken place. The dashboard can be adjusted to display broad trends or fine details, as desired, in real time or for preparing quality reports.
Data are displayed in a matter of seconds as users modify filters, and mousing over individual points on the charts displays the corresponding numbers. “STS is committed to delivering innovative, cloud-based access to the STS National Database,” said Dr. Badhwar. “This unique tool brings it all together.”
The Dashboard is available now to all ACSD participants via “Operational Reports” in the left navigation menu on the STS IQVIA platform. For training and tips on using the dashboard, a short video demonstration and a recorded webinar are available on the STS YouTube channel.